This function computes the estimate of the roughness parameter function tau(t) using the pointwise standard deviation of the standardized and differentiated sample functions.
tau_fun.RdThis function computes the estimate of the roughness parameter function tau(t) using the pointwise standard deviation of the standardized and differentiated sample functions.
Arguments
- x
Matrix of sample functions (nrow=p, ncol=n, p=number of discretization point, n=sample size).
Examples
p <- 200
N <- 10
rangeval <- c(0,1)
grid <- make_grid(p, rangevals=rangeval)
mu <- meanf_poly(grid, params = c(0,0))
# Generate random functions using a stationary
# covariance function (homogeneous roughness (HR))
cov.m = make_cov_m(cov.f = covf_st_matern, grid=grid,
cov.f.params=c(2,2))
X_HR <- make_sample(mean.v = mu, cov.m = cov.m, N = N, dist = "rnorm")
# Generate random functions using non-stationary
# covariance function (increasing roughness (IR))
cov.m = make_cov_m(cov.f = covf_nonst_matern, grid=grid,
cov.f.params=c(3/2, 1/2, 2))
X_IR <- make_sample(mean.v = mu, cov.m = cov.m, N = N, dist = "rnorm")
# Estimate tau(t):
tau_HR <- tau_fun(X_HR)
tau_IR <- tau_fun(X_IR)
# Plot data and estimated tau() functions
par(mfrow=c(2,2))
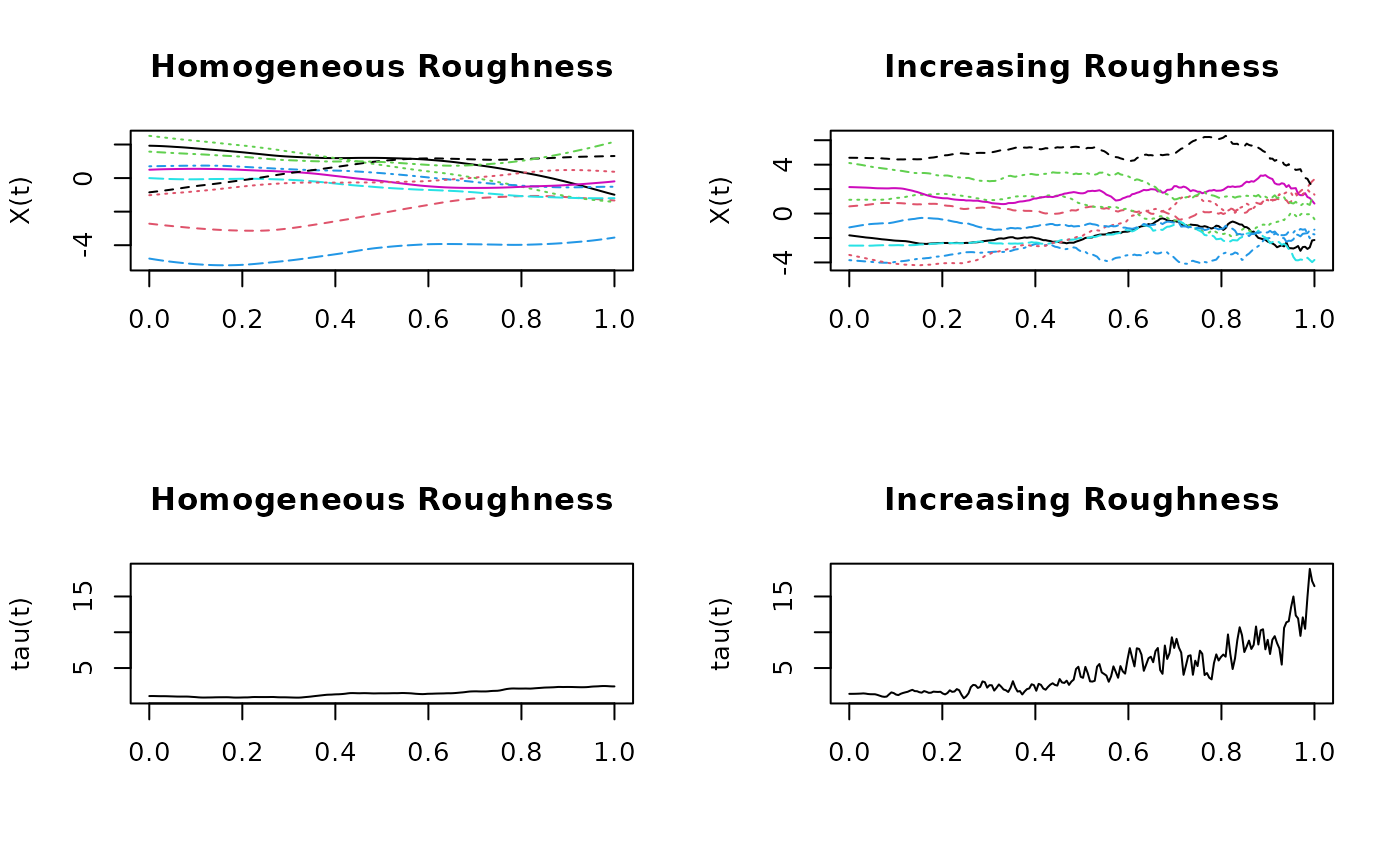
matplot(x=grid, y=X_HR, type="l", main="Homogeneous Roughness",
ylab="X(t)", xlab="")
matplot(x=grid, y=X_IR, type="l", main="Increasing Roughness",
ylab="X(t)", xlab="")
plot(x=grid, y=tau_HR, type="l", main="Homogeneous Roughness",
ylab="tau(t)", xlab="", ylim=range(tau_HR, tau_IR))
plot(x=grid, y=tau_IR, type="l", main="Increasing Roughness",
ylab="tau(t)", xlab="", ylim=range(tau_HR, tau_IR))
 par(mfrow=c(1,1))