This function computes the estimate of the roughness parameter function tau(t) using the covariance function (given as a matrix) of the functional data.
cov2tau_fun.RdThis function computes the estimate of the roughness parameter function tau(t) using the covariance function (given as a matrix) of the functional data.
Arguments
- cov_mat
Matrix (pxp) of evaluated covariance function (p=number of discretization point). Caution: It is assumed that the evaluation grid is within [0,1].
- warn
Option for printing warnings
Examples
p <- 200
N <- 10
rangeval <- c(0,1)
grid <- make_grid(p, rangevals=rangeval)
mu <- meanf_poly(grid, params = c(0,0))
# Generate random functions using a stationary
# covariance function (homogeneous roughness (HR))
cov.m = make_cov_m(cov.f = covf_st_matern, grid=grid,
cov.f.params=c(2,2,2))
X_HR <- make_sample(mean.v = mu, cov.m = cov.m, N = N, dist = "rnorm")
# Generate random functions using non-stationary
# covariance function (increasing roughness (IR))
cov.m = make_cov_m(cov.f = covf_nonst_matern, grid=grid,
cov.f.params=c(3/2, 1/2, 2))
X_IR <- make_sample(mean.v = mu, cov.m = cov.m, N = N, dist = "rnorm")
# Estimate covariance functions
hat_mu_HR <- rowMeans(X_HR)
hat_cov_HR <- crossprod(t(X_HR - hat_mu_HR)) / (N-1)
hat_mu_IR <- rowMeans(X_IR)
hat_cov_IR <- crossprod(t(X_IR - hat_mu_IR)) / (N-1)
# Estimate tau(t):
tau_HR <- cov2tau_fun(hat_cov_HR)
tau_IR <- cov2tau_fun(hat_cov_IR)
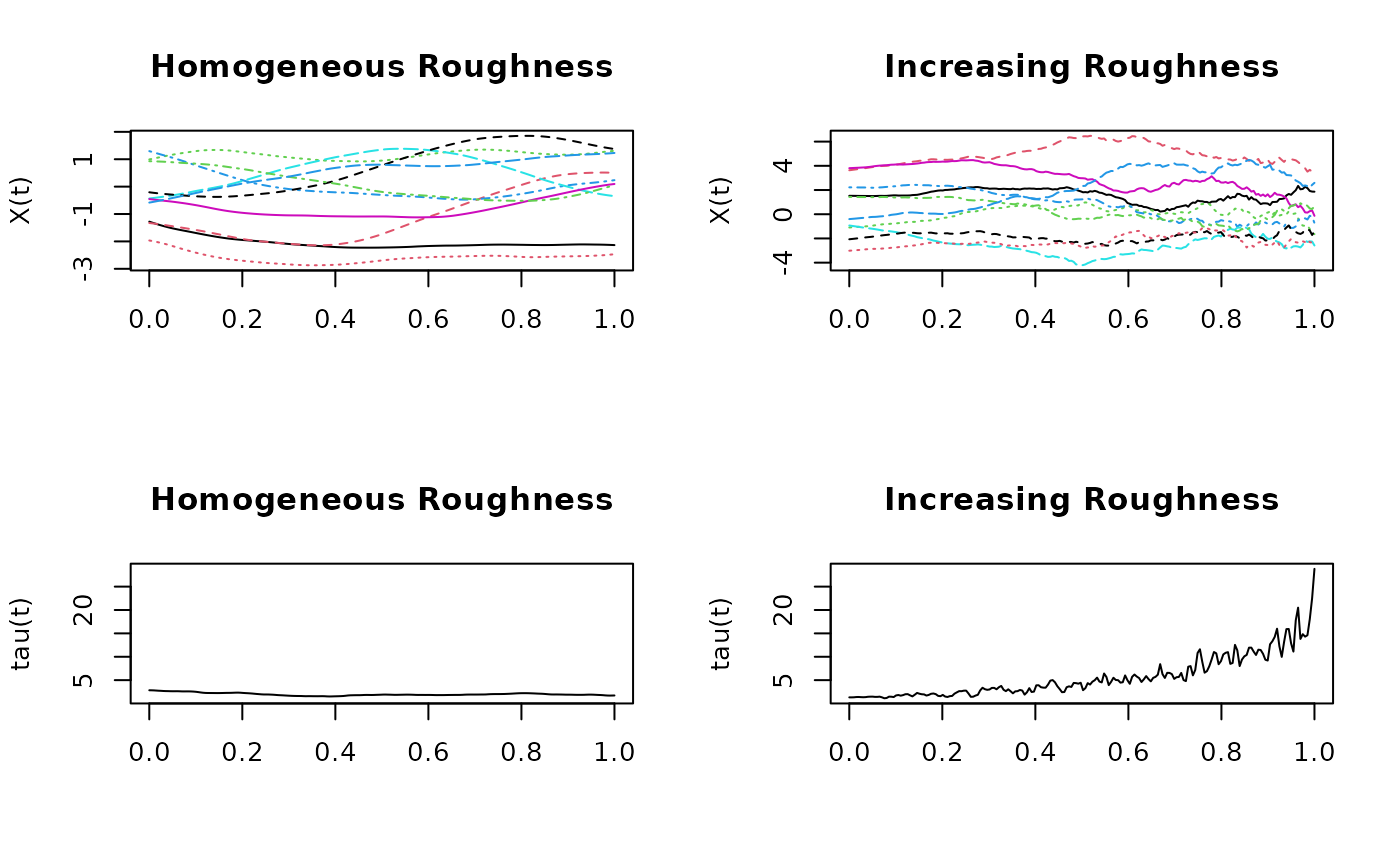
# Plot data and estimated tau() functions
par(mfrow=c(2,2))
matplot(x=grid, y=X_HR, type="l", main="Homogeneous Roughness",
ylab="X(t)", xlab="")
matplot(x=grid, y=X_IR, type="l", main="Increasing Roughness",
ylab="X(t)", xlab="")
plot(x=grid, y=tau_HR, type="l", main="Homogeneous Roughness",
ylab="tau(t)", xlab="", ylim=range(tau_HR, tau_IR))
plot(x=grid, y=tau_IR, type="l", main="Increasing Roughness",
ylab="tau(t)", xlab="", ylim=range(tau_HR, tau_IR))
 par(mfrow=c(1,1))